Using the Active Scripting Debug API to log all JavaScript that IE executes
You can download the free TraceJS program here. Run it, select the Internet Explorer instance you are interested in, and you’ll be able to see all JavaScript it executes. If you get an error starting it up, it is likely you do not have Microsoft’s Active Scripting Debug API installed. You can download the Microsoft Script Debugger, which will install it, here.
Sometimes I get the germ of an idea and I won’t let go until I have implemented it. In this case I wanted to see every line of JavaScript code that was being executed inside Internet explorer. There are plenty of library routines that let you instrument your code, but I wanted something different.
I wanted to actually hook into Internet explorer somehow. A debugger API seemed like the obvious way to go. But which debugger the API? There are so many to choose from. In the end I discovered that the Active Scripting API was what I needed. Unfortunately it’s been a long time since anyone has used that it API. Especially from .NET. There were a smattering of articles on the web but none did exactly what I wanted.
In order to use it from .NET I needed a type library in order to generate a COM Interop assembly. Eventually I found one in an old version of the Internet explorer SDK. Having generated to the Interop assembly I found I needed to make some corrections. So I generated an IL file corrected it and regenerated the assembly.
For a long time when I first used the API it did not seem to be working. I could not connect to Internet Explorer. The call to connect failed every time. I eventually discovered that it had actually worked the first time and that subsequent attempts to connect were failing because there was already a debugger attached. DOH!
From there on it was pretty plain sailing. As soon as I attached the debugger I requested a breakpoint. I received a call back when the breakpoint occurred and then logged all the information about the current statement including the filename, the function name, the current stack depth, the line number, and of course the current chunk of JavaScript that was being executed. This is the callback code that gets executed when a breakpoint occurs:
// Called on breakpoint, which is for each statement in the target app
public void onHandleBreakPoint(IRemoteDebugApplicationThread prpt,
                               tagBREAKREASON br,
                               IActiveScriptErrorDebug pError)
{
    try
    {
        // Properties of the current breakpoint which we will be fetching
        string fileName;
        string functionName;
        string code = "";

        // Various interfaces and structs used for active script debugging
        IEnumDebugStackFrames enumDebugStackFrames;
        tagDebugStackFrameDescriptor debugStackFrameDescriptor;
        IDebugCodeContext debugCodeContext;
        IDebugDocumentContext debugDocumentContext;
        IDebugDocument debugDocument;

        // Get the function name from the first stack frame
        prpt.EnumStackFrames(out enumDebugStackFrames);
        uint stackFrameCount;
        enumDebugStackFrames.RemoteNext(1, out debugStackFrameDescriptor,
                                out stackFrameCount);
        if (stackFrameCount != 1)
        {
            return;
        }

        debugStackFrameDescriptor.pdsf.GetDescriptionString(0,
                                                            out functionName);

        // Get the file name
        debugStackFrameDescriptor.pdsf.GetCodeContext(out debugCodeContext);
        debugCodeContext.GetDocumentContext(out debugDocumentContext);
        debugDocumentContext.GetDocument(out debugDocument);
        debugDocument.GetName(tagDOCUMENTNAMETYPE.DOCUMENTNAMETYPE_URL,
                              out fileName);

        // If we are not in the same file and function as previous
        // breakpoint, then find the stack depth
        if (fileName != lastFile || functionName != lastFunction)
        {
            stackDepth = 0;

            while (stackFrameCount == 1)
            {
                tagDebugStackFrameDescriptor tmpDebugStackFrameDescriptor;
                enumDebugStackFrames.RemoteNext(1,
                                                out tmpDebugStackFrameDescriptor,
                                                out stackFrameCount);
                stackDepth++;
            }
        }

        // The DebugDocumentText lets us get at the document text
        IDebugDocumentText ddt = debugDocument as IDebugDocumentText;
        if (ddt == null)
        {
            return;
        }

        // Find out the location of the chunk of code is currently
        // being stepped through
        uint charPosition = 0;
        uint nrChars = 0;
        ddt.GetPositionOfContext(debugDocumentContext,
                                 out charPosition,
                                 out nrChars);

        // Find out what line it is on
        uint lineNr = 0;
        uint offsetInLine;
        ddt.GetLineOfPosition(charPosition, out lineNr, out offsetInLine);

        // Get the chunk of code that is being stepped through.
        if (nrChars >= 0)
        {
            if(nrChars > codeBuffer.Length - 1) {
                nrChars = (uint)codeBuffer.Length - 1;
            }

            uint charsReturned = 0;
            ddt.GetText(charPosition, codeBufferPtr, IntPtr.Zero,
                        ref charsReturned,
                        nrChars);
            code = new String(codeBuffer, 0, (int)charsReturned);
        }

        // Tell any listeners about the new trace message
        TraceEventArgs traceEventArgs = new TraceEventArgs(fileName,
                                                           functionName,
                                                           stackDepth,
                                                           (int)lineNr,
                                                           code);
        OnTraceStep(traceEventArgs);
    }
    catch (Exception ex)
    {
        Console.WriteLine(ex);
    }
    finally
    {
        try
        {
            // Resume the process, indicating we want to break at the next available point
            debuggableApplication.RemoteDebugApplication.ResumeFromBreakPoint(prpt,
                  tagBREAKRESUME_ACTION.BREAKRESUMEACTION_STEP_INTO,
                  tagERRORRESUMEACTION.ERRORRESUMEACTION_AbortCallAndReturnErrorToCaller);
        }
        catch (Exception ex)
        {
            Console.WriteLine("Error resuming: " + ex);
        }
    }
}
Of course this has an impact on performance, but it does let you see every line of code that has run. It can be quite illuminating to trace through the Microsoft ASP.NET AJAX runtime and see exactly how much work it does on your behalf. You can also use it to see if your JavaScript code is doing what you think it is doing, without having to step through it in the debugger.
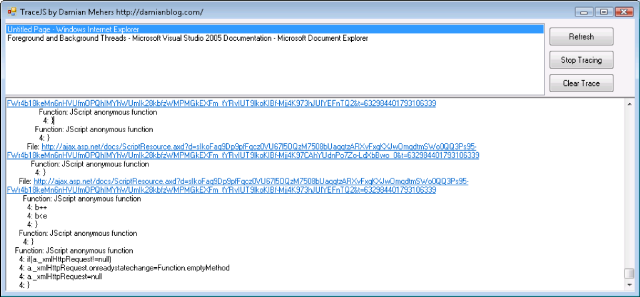
For example this is the trace from the first update panel example in the ASP.NET AJAX documentation.
I put a simple graphical interface on top of the program:
You can download the program here, and the complete source is available here.
I can imagine that this could be extended to include filtering, displaying parameters, code coverage and possibly performance metrics but as it stands I think it’s already quite useful to see every line of code that has run without having to manually step through the debugger. I’m happy to contribute it to CodePlex if anyone wants to take it further.
