Using mdbg to debug at the MSIL level instead of assembly code.
Windows Media Center (MCE) lets you create addins to provide new functionality. There are two kinds of addins -- normal addins, and background addins. Background addins run continuously as soon as MCE starts up, and are limited in the user-interaction they provide.
One thing they are allowed to do is to pop up a dialog message to the user using the AddInHost.Current.MediaCenterEnvironment.Dialog(...) method call.
I was doing this in my background addin, but I was getting an error from MCE saying that I was not allowed to make that call.
Addins run in separate processes to the main MCE process, which is ehshell.exe, and the Dialog call is remoted into the ehshell.exe process.
Using Reflector I could see that the call was eventually failing in MediaCenter.Extensibility.ExtensibilityAutomation.EnforceApplicationPermission(...) which was calling through to Microsoft.MediaCenter.Hosting.Infrastructure.RegisteredApps.IsBackgroundEntryPoint which looks like this:
public static bool IsBackgroundEntryPoint(ExtensibilityEntryPointInfo epi)
{
return (0 == string.Compare(epi.Category, "Background", true,
CultureInfo.InvariantCulture));
}
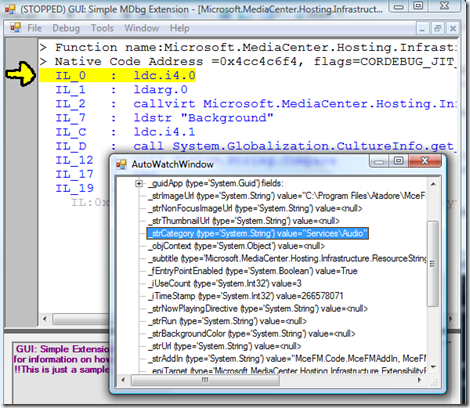
Somehow I needed a way to use the debugger to see what the epi.Category value was when the call was failing.
The standard Visual Studio debugger just drops you through to x86 assembly code if it has no debugging symbols. I needed a debugger which shows .NET IL instead.
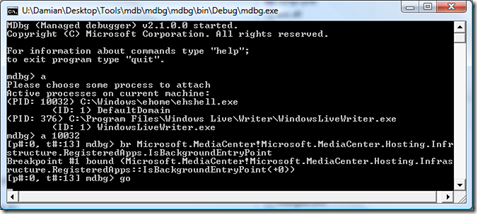
This is where mdbg comes in. Mdbg is a command line debugger created by Mike Stall.
Once you have downloaded it and started running it, then you can use the 'a' command to list available processes, and then 'a Once attached, you can set a breakpoint using 'br Once the breakpoint is hit, you can use the 'print' command to display a parameter value: There is also a GUI which can be invoked using 'load gui':


